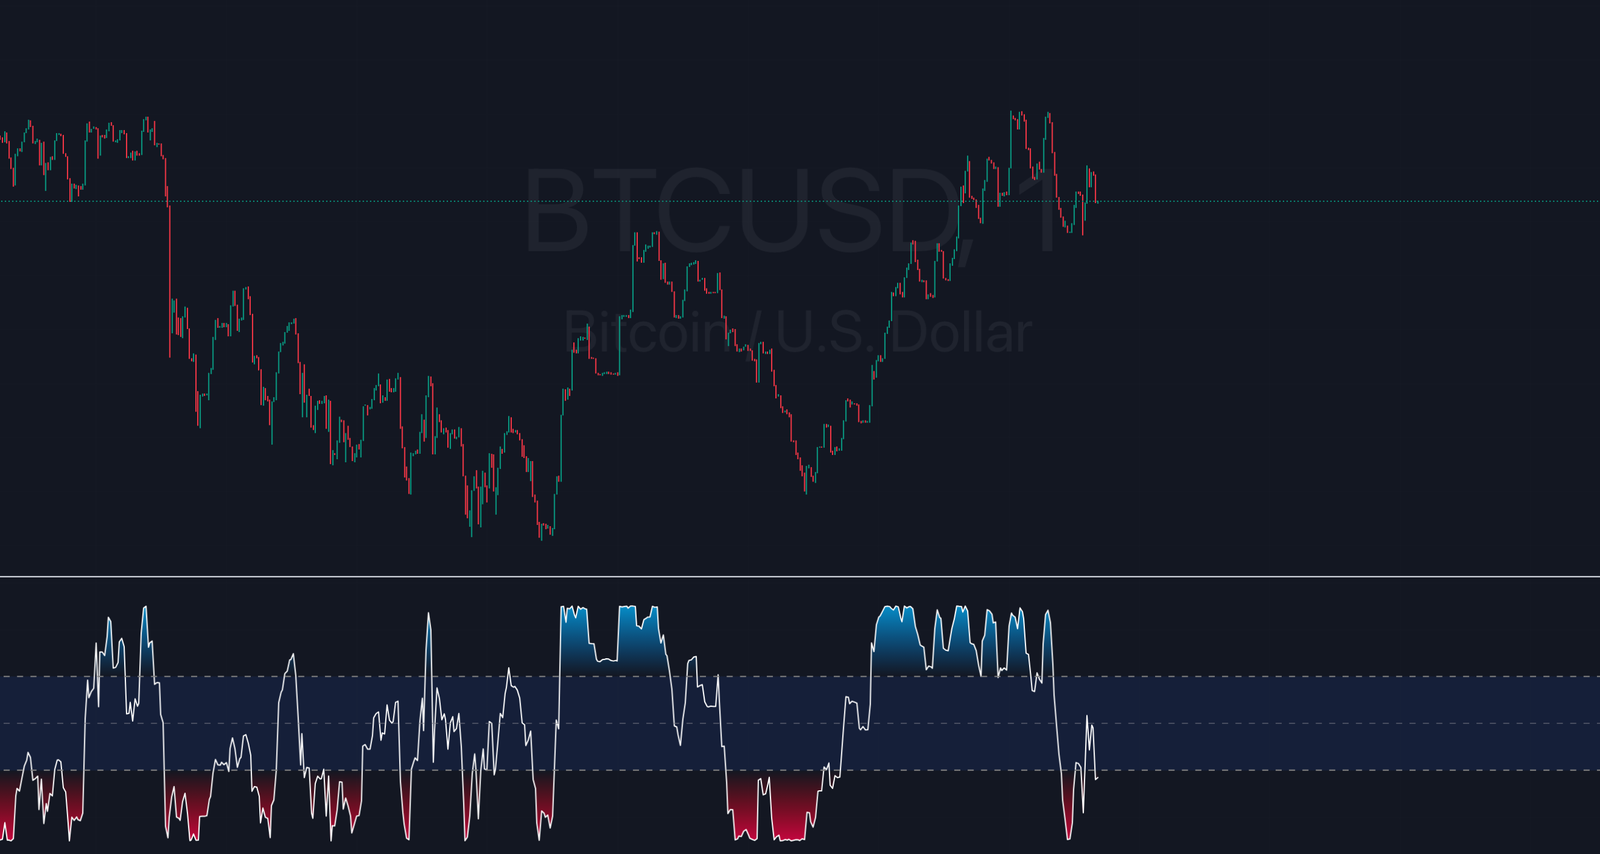
Scalper Pro SMI
Scalper Pro SMI is ideal TradingView indicator for scalpers and day traders looking for quick entries and exits based on short-term price momentum.


High Performance Signals
The algorithm gives signals when to open and close trades to get the maximum possible results from almost every price movement.
Integrated Money Management
Built-in position size calculator helps to calculate the appropriate size of your trade.
Non-Repainting Signals
Reliable signals 100% percent without repainting
Next Gen Algorithm
The adaptive Trend Channel and the Swing Signal indicator are powerful tools that make market analysis easy and accessible.
Multi Time Frame Panel
Is an ideal way to visualize the trend on higher time frame charts.
Smart Swing Technology
Our algorithms simplify analysis and risk management.
Scalper Pro SMI
The Scalper Pro SMI is a technical indicator designed to assist traders in identifying potential overbought and oversold conditions in the market. It uses the Stochastic Momentum Index (SMI), which is a refined version of the Stochastic Oscillator, to provide more precise signals for price momentum.
How It Works:
- The SMI measures the distance of the current price from the midpoint of the highest and lowest prices over a specified period (
lengthK, set to 50 by default). - The indicator smooths these values using exponential moving averages (EMA) to reduce noise and improve accuracy.
- The resulting SMI values range between positive and negative values, indicating whether the market is trending toward overbought (high positive values) or oversold (high negative values) conditions.
Key Features:
Overbought/Oversold Levels:
- Two horizontal lines at +40 and -40 represent the overbought and oversold regions, respectively.
- When the SMI crosses above +40, the market might be overbought, suggesting potential selling opportunities.
- When the SMI crosses below -40, the market might be oversold, indicating potential buying opportunities.
Gradient Visuals:
- The script uses gradient fills to visually highlight overbought and oversold areas:
- Blue gradient for the overbought zone (+40 to +120).
- Red gradient for the oversold zone (-40 to -120).
- This color-coding makes it easy to quickly assess the current market condition.
- The script uses gradient fills to visually highlight overbought and oversold areas:
Center Line:
- A middle line is plotted at 0, which helps traders identify whether the SMI is in a positive (bullish) or negative (bearish) region.
How to Use:
- Buy signals occur when the SMI rises from the oversold region (below -40) and crosses the center line toward positive values, indicating potential upward momentum.
- Sell signals appear when the SMI drops from the overbought region (above +40) and crosses downward, indicating potential bearish momentum.
- The gradient fill provides a visual aid to quickly spot these zones and act accordingly.
Benefits for Users:
- Early signal detection: The SMI is a leading momentum indicator, helping traders identify potential reversals before they occur.
- Clear visual guidance: The gradient fills and color-coding make it easier to spot overbought and oversold conditions without needing to interpret complex charts.
- Customizable settings: Users can adjust the lengths for the smoothing periods to fit different assets or trading styles.
Scalper Pro SMI is ideal TradingView indicator for scalpers and day traders looking for quick entries and exits based on short-term price momentum.
Scalper Pro SMI
Trading is inherently risky, and many participants may incur losses. The content on this site is not intended as financial advice and should not be interpreted as such. Decisions regarding buying, selling, holding, or trading in securities, commodities, and other markets involve risks that are best addressed with the guidance of qualified financial professionals. Past performance does not guarantee future results.
Hypothetical or simulated performance results have limitations. Unlike actual trading records, simulated results do not represent real trades. Additionally, since these trades have not been executed, the results may not accurately reflect the impact of market factors such as liquidity. Simulated trading programs are typically designed with the benefit of hindsight and based on historical data. There is no assurance that any account will achieve similar profits or losses as shown in simulated results.
Testimonials on this website may not reflect the experiences of other clients and are not a guarantee of future performance or success.
As a provider of technical analysis tools for charting platforms, we do not have access to our customers’ personal trading accounts or brokerage statements. Therefore, we do not assume that our customers perform better or worse than other traders based on any content or tools we provide.
Charts used on this site are powered by TradingView, on which many of our tools are built. TradingView® is a registered trademark of TradingView, Inc. (www.TradingView.com). TradingView® has no affiliation with the owner, developer, or provider of the Services described on this site.
This summary does not represent our full disclaimer. Please refer to our full disclaimer for complete information.
