Gold Trader
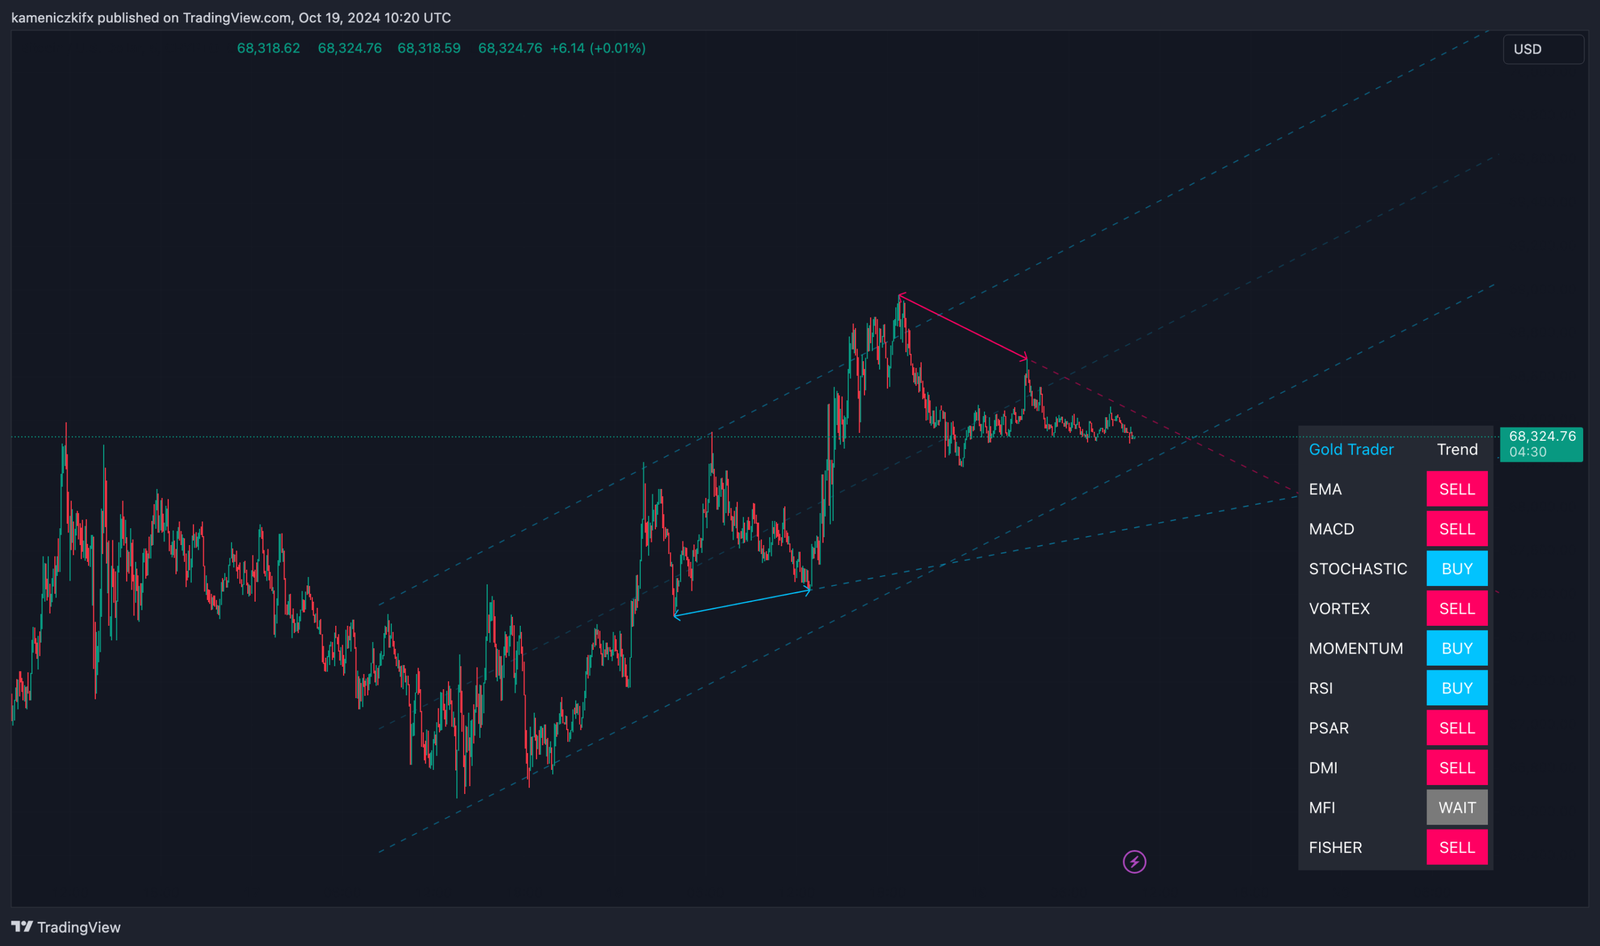
The Gold Trader TradingView Indicator is a sophisticated custom-built tool designed for analyzing Gold (or other assets) by employing statistical techniques to assess price action. It identifies key price channels, evaluates trend strength, and alerts users to potential breakouts or reversals using Pearson’s R correlation coefficient. This indicator provides a comprehensive view of price movements by dynamically plotting channels and detecting significant price shifts, allowing traders to gauge market conditions with high precision.


High Performance Signals
The algorithm gives signals when to open and close trades to get the maximum possible results from almost every price movement.
Integrated Money Management
Built-in position size calculator helps to calculate the appropriate size of your trade.
Non-Repainting Signals
Reliable signals 100% percent without repainting
Next Gen Algorithm
The adaptive Trend Channel and the Swing Signal indicator are powerful tools that make market analysis easy and accessible.
Multi Time Frame Panel
Is an ideal way to visualize the trend on higher time frame charts.
Smart Swing Technology
Our algorithms simplify analysis and risk management.
Gold Trader
Gold Trader TradingView Indicator combines the Long-Range Trend Line (LRTL) with the Smart Money Concept (SMC) to identify key market levels, trends, and potential reversals. Using LRTL, it highlights major trend lines, while SMC analyzes market swings and trend changes. Non Repainting Indicator for Scalping, Day & Swing Trading. Gold Trader works reliably on all time slots: 1M, 5M, 15M, 1H, 4H, 1D.
Key Functions:
Pearson’s R Calculation:
The indicator measures the correlation strength between price movement and the projected trend using Pearson’s R. This statistical tool offers confidence levels from “Extremely Weak” to “Ultra Strong,” helping traders assess the reliability of the ongoing trend.
Deviation Channels:
The tool calculates upper and lower deviation channels based on historical price data and standard deviation from the trendline, identifying overbought or oversold zones with precision.
Dynamic Channel Plotting:
The indicator adjusts channel lines dynamically based on the detected trend and time period, visualizing the midline, upper, and lower channels in real-time. This helps traders focus on key levels without needing to manually draw trend channels.
Alerts for Crossings:
Alerts are triggered when the price crosses above or below the deviation channels, warning traders of potential breakouts or breakdowns, allowing them to act on these significant market movements quickly.
Trendline Visualization:
It offers adjustable settings to draw trendlines that illustrate support and resistance levels clearly. Violated trendlines are optionally labeled, helping traders identify when trends are weakening or reversing.
Benefits for Traders:
Trend Strength Assessment:
By incorporating Pearson’s R, the indicator gives traders a reliable measure of trend strength. This helps in distinguishing between strong trends that are likely to continue and weaker trends that may soon reverse.
Dynamic Channel Creation:
Adaptive plotting of price channels provides a visual framework for identifying potential reversal zones. Traders can quickly assess whether the price is approaching critical support or resistance levels.
Custom Alerts:
Real-time alerts for price movements outside the deviation channels keep traders informed without needing constant chart monitoring. This ensures traders don’t miss key price movements, increasing responsiveness.
Highly Configurable:
The indicator’s customizable settings for channel style, transparency, and alert configurations make it flexible to suit different trading styles. Traders can adapt the tool to fit their strategy, whether they are day traders, swing traders, or long-term investors.
Risk Management:
By identifying key overbought and oversold conditions, the Gold Trader Indicator aids in managing risk by highlighting optimal points for entering or exiting trades. It enables traders to spot false breakouts or trend reversals before committing to a trade.
The Gold Trader TradingView Indicator combines robust statistical methods with dynamic visual tools to empower traders with clear insights into market conditions. By offering adaptive channel plotting, trend correlation analysis, and custom alerts, this tool enhances decision-making and helps traders capitalize on trading opportunities in Gold and other assets with increased confidence.
Enhanced Indicator Functionality:
- Added customizable EMA settings to provide more control over trend detection.
- Introduced a new RSI signal system for better overbought/oversold identification.
- Updated MACD settings with additional signal filtering options.
User Interface Improvements:
- The layout of the indicator table can now be adjusted for better readability.
- Added a feature to enable/disable individual indicators directly from the settings menu.
New Alert Conditions:
- Enhanced alert system to allow users to create custom alerts based on combined signals from multiple indicators.
- Introduced new alert options based on trend reversals and breakout patterns.
Performance Optimizations:
- Improved calculation speed for large data sets, ensuring faster response times.
- Optimized the indicator logic to reduce repainting and improve the reliability of the signals.
Visual Enhancements:
- Introduced new charting colors and background gradients to make it easier to identify key market zones.
- Added color-coded buy/sell signals for quicker interpretation of trade setups.
Bug Fixes:
- Resolved issues with incorrect signal generation under certain market conditions.
- Fixed the alert notification system to ensure accurate and timely alerts.
These changes make Gold Trader 4.2 more powerful, user-friendly, and reliable for traders looking to analyze gold market trends efficiently.
Get Gold Trader Indicator Now
Trading is inherently risky, and many participants may incur losses. The content on this site is not intended as financial advice and should not be interpreted as such. Decisions regarding buying, selling, holding, or trading in securities, commodities, and other markets involve risks that are best addressed with the guidance of qualified financial professionals. Past performance does not guarantee future results.
Hypothetical or simulated performance results have limitations. Unlike actual trading records, simulated results do not represent real trades. Additionally, since these trades have not been executed, the results may not accurately reflect the impact of market factors such as liquidity. Simulated trading programs are typically designed with the benefit of hindsight and based on historical data. There is no assurance that any account will achieve similar profits or losses as shown in simulated results.
Testimonials on this website may not reflect the experiences of other clients and are not a guarantee of future performance or success.
As a provider of technical analysis tools for charting platforms, we do not have access to our customers’ personal trading accounts or brokerage statements. Therefore, we do not assume that our customers perform better or worse than other traders based on any content or tools we provide.
Charts used on this site are powered by TradingView, on which many of our tools are built. TradingView® is a registered trademark of TradingView, Inc. (www.TradingView.com). TradingView® has no affiliation with the owner, developer, or provider of the Services described on this site.
This summary does not represent our full disclaimer. Please refer to our full disclaimer for complete information.
