NZDUSD • GBPUSD • AUDUSD • NATGAS • GOLD • SILVER • WTI.OIL • NASDAQ • US500 • GE30 • EURUSD • USDJPY • BTCUSD • GOLD • SILVER • WTI.OIL
Trading Easily
Wall Street AI TradingView Indicator with Market Crash Protection
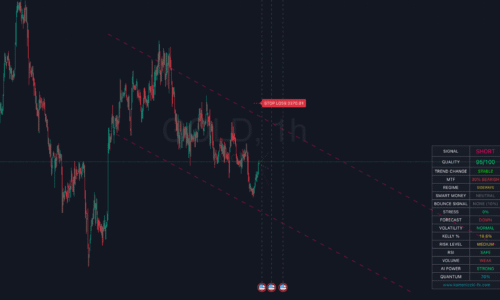
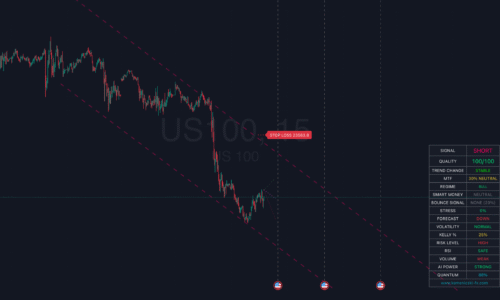
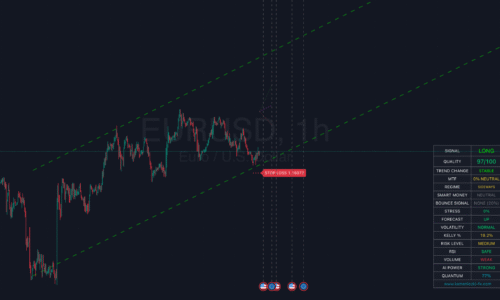
Izabell Wall Street AI Trading Assistant is a revolutionary AI indicator for TradingView that combines the power of AI, quantum analysis, and an advanced trailing stop loss system. With market crash protection, it can automatically detect extreme market stress, increased volatility, and sudden price drops, protecting the trader from dramatic losses.
SIGNAL
The main directional signal (LONG/SHORT) based on advanced statistical and price calculations.
Benefit: The trader always has a clear indicator of the current trend at hand and knows whether the market favors bulls or bears.
QUALITY
A signal quality rating from 0 to 100.
Benefit: The user can distinguish whether it is a highly credible opportunity or a risky signal that is better left out. Quality acts as a filter to reduce the number of false entries.
TREND CHANGE
Detection of a possible trend reversal using correlations, volatility, breakouts and momentum.
Benefit: Early warning of a trend change allows you to quickly protect capital, close profitable positions or prepare for a new market direction.
MTF
Analysis of multiple higher timeframes and their alignment with the current chart.
Benefit: The trader receives confirmation that his trade is not just a short-term swing, but also has support on higher timeframes – this increases the success of trades.
REGIME
Identification of the market regime (BULL, BEAR, STRONG TREND, SIDEWAYS).
Benefit: The user immediately knows in what environment he is trading – whether it is appropriate to go with the trend, look for rebounds or be cautious in a sideways market.
SMART MONEY
Detection of institutional activities (accumulation, distribution, buying or selling pressure).
Benefit: The trader gets insight into what the “big players” are doing and can join their side instead of fighting against them.
BOUNCE SIGNAL
Bounce signals from channel boundaries with quality rating.
Benefit: Clear visual aid for finding entries at support and resistance. Great for swing and intraday strategies.
STRESS MONITOR
A market stress indicator (0–100%) that reflects volatility, volume, and extremes in RSI.
Benefit: High stress means higher risk – the trader knows when to reduce position size or wait for the market to stabilize.
FORECAST
Quasi-prediction of future price development using quantum correlation analysis.
Benefit: Visualizing possible development scenarios gives the trader a head start and helps in planning entries, exits and setting targets.
VOLATILITY
Current volatility indicator (HIGH/NORMAL).
Benefit: The trader can adjust the strategy – in periods of high volatility, the profit potential increases, but also the risk, while in a calm market, patience is appropriate.
KELLY RISK LEVEL
Advanced calculation of optimal position size according to the Kelly criterion, adapted to current conditions.
Benefit: Intelligent risk management helps maximize account growth without excessive risk.
RSI
Information about overbought/oversold market (SAFE/RISK).
Benefit: A simple filter that helps avoid trades against extremes.
VOLUME
Confirmation of signals through volumes (CONFIRMED/WEAK).
Benefit: Increased reliability of trades – a quality movement is always supported by strong volume.
AI POWER
Evaluation of signal strength using artificial intelligence.
Benefit: The trader receives an independent “second check” of the signal, which reduces the chance of human error.
QUANTUM
Advanced quantum correlation method for market analysis.
Benefit: Higher signal accuracy and the ability to see even those connections that conventional indicators cannot reveal.
CHANNEL COLORS
Dynamic colorization of the price channel according to the current trend and strength of the movement.
Benefit: The trader can immediately see whether the market favors bulls or bears, which saves time in analysis and increases the accuracy of entries.
TRAILING STOP LOSS
Advanced Trailing Stop Loss system that automatically adjusts to the current trend, volatility and signal strength.
Benefit: Stop Loss moves only in favor of profit – for LONG it moves higher, for SHORT it moves lower – thus locking in profits and minimizing the risk of premature exit of the trade.
ALERTS
An advanced alert system that combines multiple conditions (trend, signal quality, volume, stress, volatility).
Benefit: Trader receives notifications only when a relevant and high-quality trading opportunity appears – without being overwhelmed by unnecessary signals.
Step by Step
Start Trading Easily with AI Izabell
It is easy to get started with Izabell and start trading profitably.
Step 1
Create a Free Account on TradingView
If you don’t have an account, create a free one at TradingView.com.

Step 2
Enter TradingView Username on Checkout
Enter your TradingView username when purchasing Izabell at checkout.

Step 3
Start using out Indicator on TradingView
Once purchased, go to TradingView and simply add Izabell to the chart.

Our Reviews
From traders to traders
Choose Your Plan
Pricing plans
AI Izabell Lite
$190
/yearly
7 Days Free Trial
AI Izabell Pro
$990
/yearly
7 Days Free Trial
We offer a 30-day money-back guarantee, with the option to cancel anytime. After signing up, you’ll receive an instant access. Please note, trading is done at your own risk.
Frequently asked questions
Trading is inherently risky, and many participants may incur losses. The content on this site is not intended as financial advice and should not be interpreted as such. Decisions regarding buying, selling, holding, or trading in securities, commodities, and other markets involve risks that are best addressed with the guidance of qualified financial professionals. Past performance does not guarantee future results.
Hypothetical or simulated performance results have limitations. Unlike actual trading records, simulated results do not represent real trades. Additionally, since these trades have not been executed, the results may not accurately reflect the impact of market factors such as liquidity. Simulated trading programs are typically designed with the benefit of hindsight and based on historical data. There is no assurance that any account will achieve similar profits or losses as shown in simulated results.
Testimonials on this website may not reflect the experiences of other clients and are not a guarantee of future performance or success.
As a provider of technical analysis tools for charting platforms, we do not have access to our customers’ personal trading accounts or brokerage statements. Therefore, we do not assume that our customers perform better or worse than other traders based on any content or tools we provide.
Charts used on this site are powered by TradingView, on which many of our tools are built. TradingView® is a registered trademark of TradingView, Inc. (www.TradingView.com). TradingView® has no affiliation with the owner, developer, or provider of the Services described on this site.
This summary does not represent our full disclaimer. Please refer to our full disclaimer for complete information.


