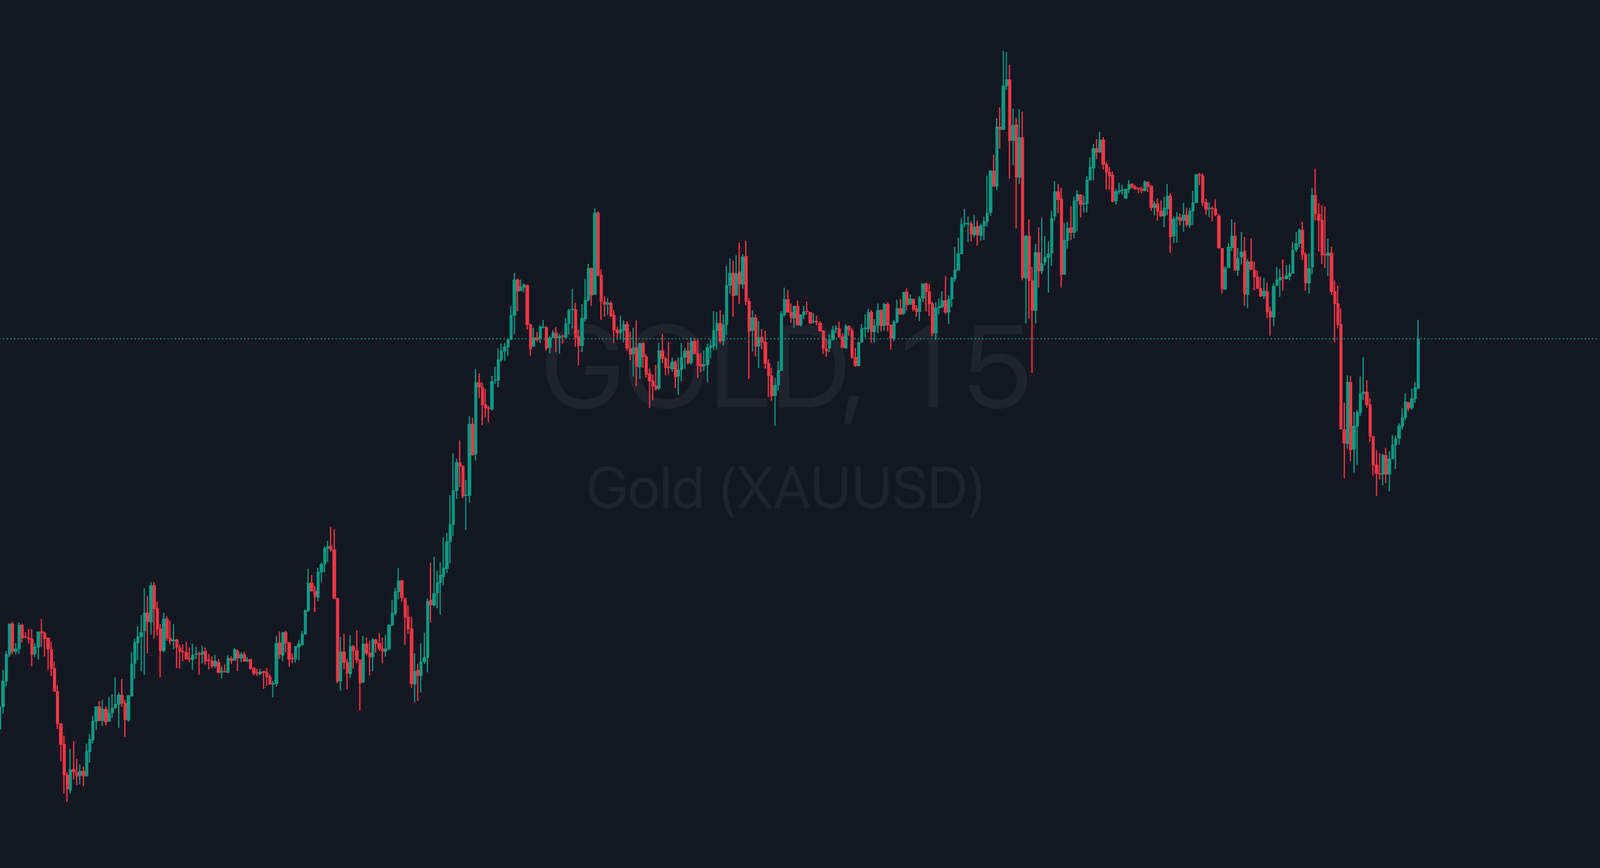
Anomaly Oscillator
The Anomaly Oscillator with Alerts is designed to help traders quickly identify abnormal price movements in the market based on deviations from a smoothed price average.


High Performance Signals
The algorithm gives signals when to open and close trades to get the maximum possible results from almost every price movement.
Integrated Money Management
Built-in position size calculator helps to calculate the appropriate size of your trade.
Non-Repainting Signals
Reliable signals 100% percent without repainting
Next Gen Algorithm
The adaptive Trend Channel and the Swing Signal indicator are powerful tools that make market analysis easy and accessible.
Multi Time Frame Panel
Is an ideal way to visualize the trend on higher time frame charts.
Smart Swing Technology
Our algorithms simplify analysis and risk management.
Anomaly Oscillator with Alerts
The Anomaly Oscillator with Alerts is designed to help traders quickly identify abnormal price movements in the market based on deviations from a smoothed price average. The indicator uses an Exponential Moving Average (EMA) and compares the current price deviation from this average to a predefined threshold to highlight potential anomalies. This can help traders spot moments of unusual price action, which could signify reversals or continuations in trend.
How It Works:
- EMA Period: You can set the length of the EMA smoothing period, which controls how sensitive the oscillator is to price movements.
- Limit Factor: This allows you to adjust the deviation threshold to define what qualifies as an anomaly. A higher limit factor will make the indicator less sensitive, only highlighting stronger deviations.
- The oscillator measures the difference between the current price and the EMA, then multiplies the standard deviation of this difference by the limit factor. This gives a range that defines what is considered a “normal” price movement.
- Based on the result, the oscillator changes colors to highlight different market conditions:
- Bright Blue: Price is significantly above the threshold, signaling a bullish anomaly.
- Faded Blue: Price is above the EMA but within the normal range, indicating moderate bullish momentum.
- Faded Red: Price is below the EMA but within the normal range, signaling moderate bearish momentum.
- Bright Red: Price is significantly below the threshold, indicating a bearish anomaly.
How to Use:
- Setup the Inputs:
- Adjust the EMA Period for smoothing price data. Lower values make the oscillator more responsive to short-term movements.
- Set the Limit Factor to control how strict the indicator is in flagging anomalies.
- Interpret the Colors:
- Bright Colors (Blue or Red): These indicate a price anomaly, which might suggest a market overreaction. This could be a potential entry or exit point depending on your strategy.
- Faded Colors: Indicate that price movements are within normal ranges, but the trend direction should still be observed.
- Alerts: You can set up custom alerts within the script to notify you when the oscillator changes color, helping you stay informed of market anomalies as they happen.
Benefits for the User:
- Early Detection of Abnormal Market Movements: By focusing on deviations from the norm, traders can anticipate potential reversals or breakouts.
- Customizable Sensitivity: The ability to adjust the EMA period and the deviation limit makes the indicator flexible to various market conditions.
- Visual Feedback: The color-coding system gives immediate visual cues to the user, allowing quick assessments of whether the market is showing normal or anomalous behavior.
- Alert Feature: You can set up alerts to get notified when anomalies occur, so you don’t miss critical moments in the market.
Anomaly oscilator with alerts is ideal for traders looking to identify and act on unusual market conditions to improve their timing for entries and exits.
Anomaly Oscillator with Alerts Now
Trading is inherently risky, and many participants may incur losses. The content on this site is not intended as financial advice and should not be interpreted as such. Decisions regarding buying, selling, holding, or trading in securities, commodities, and other markets involve risks that are best addressed with the guidance of qualified financial professionals. Past performance does not guarantee future results.
Hypothetical or simulated performance results have limitations. Unlike actual trading records, simulated results do not represent real trades. Additionally, since these trades have not been executed, the results may not accurately reflect the impact of market factors such as liquidity. Simulated trading programs are typically designed with the benefit of hindsight and based on historical data. There is no assurance that any account will achieve similar profits or losses as shown in simulated results.
Testimonials on this website may not reflect the experiences of other clients and are not a guarantee of future performance or success.
As a provider of technical analysis tools for charting platforms, we do not have access to our customers’ personal trading accounts or brokerage statements. Therefore, we do not assume that our customers perform better or worse than other traders based on any content or tools we provide.
Charts used on this site are powered by TradingView, on which many of our tools are built. TradingView® is a registered trademark of TradingView, Inc. (www.TradingView.com). TradingView® has no affiliation with the owner, developer, or provider of the Services described on this site.
This summary does not represent our full disclaimer. Please refer to our full disclaimer for complete information.
