Skip to content
Menu

Update: Kameniczki SMI 3.0 Introduces Scalping Mode

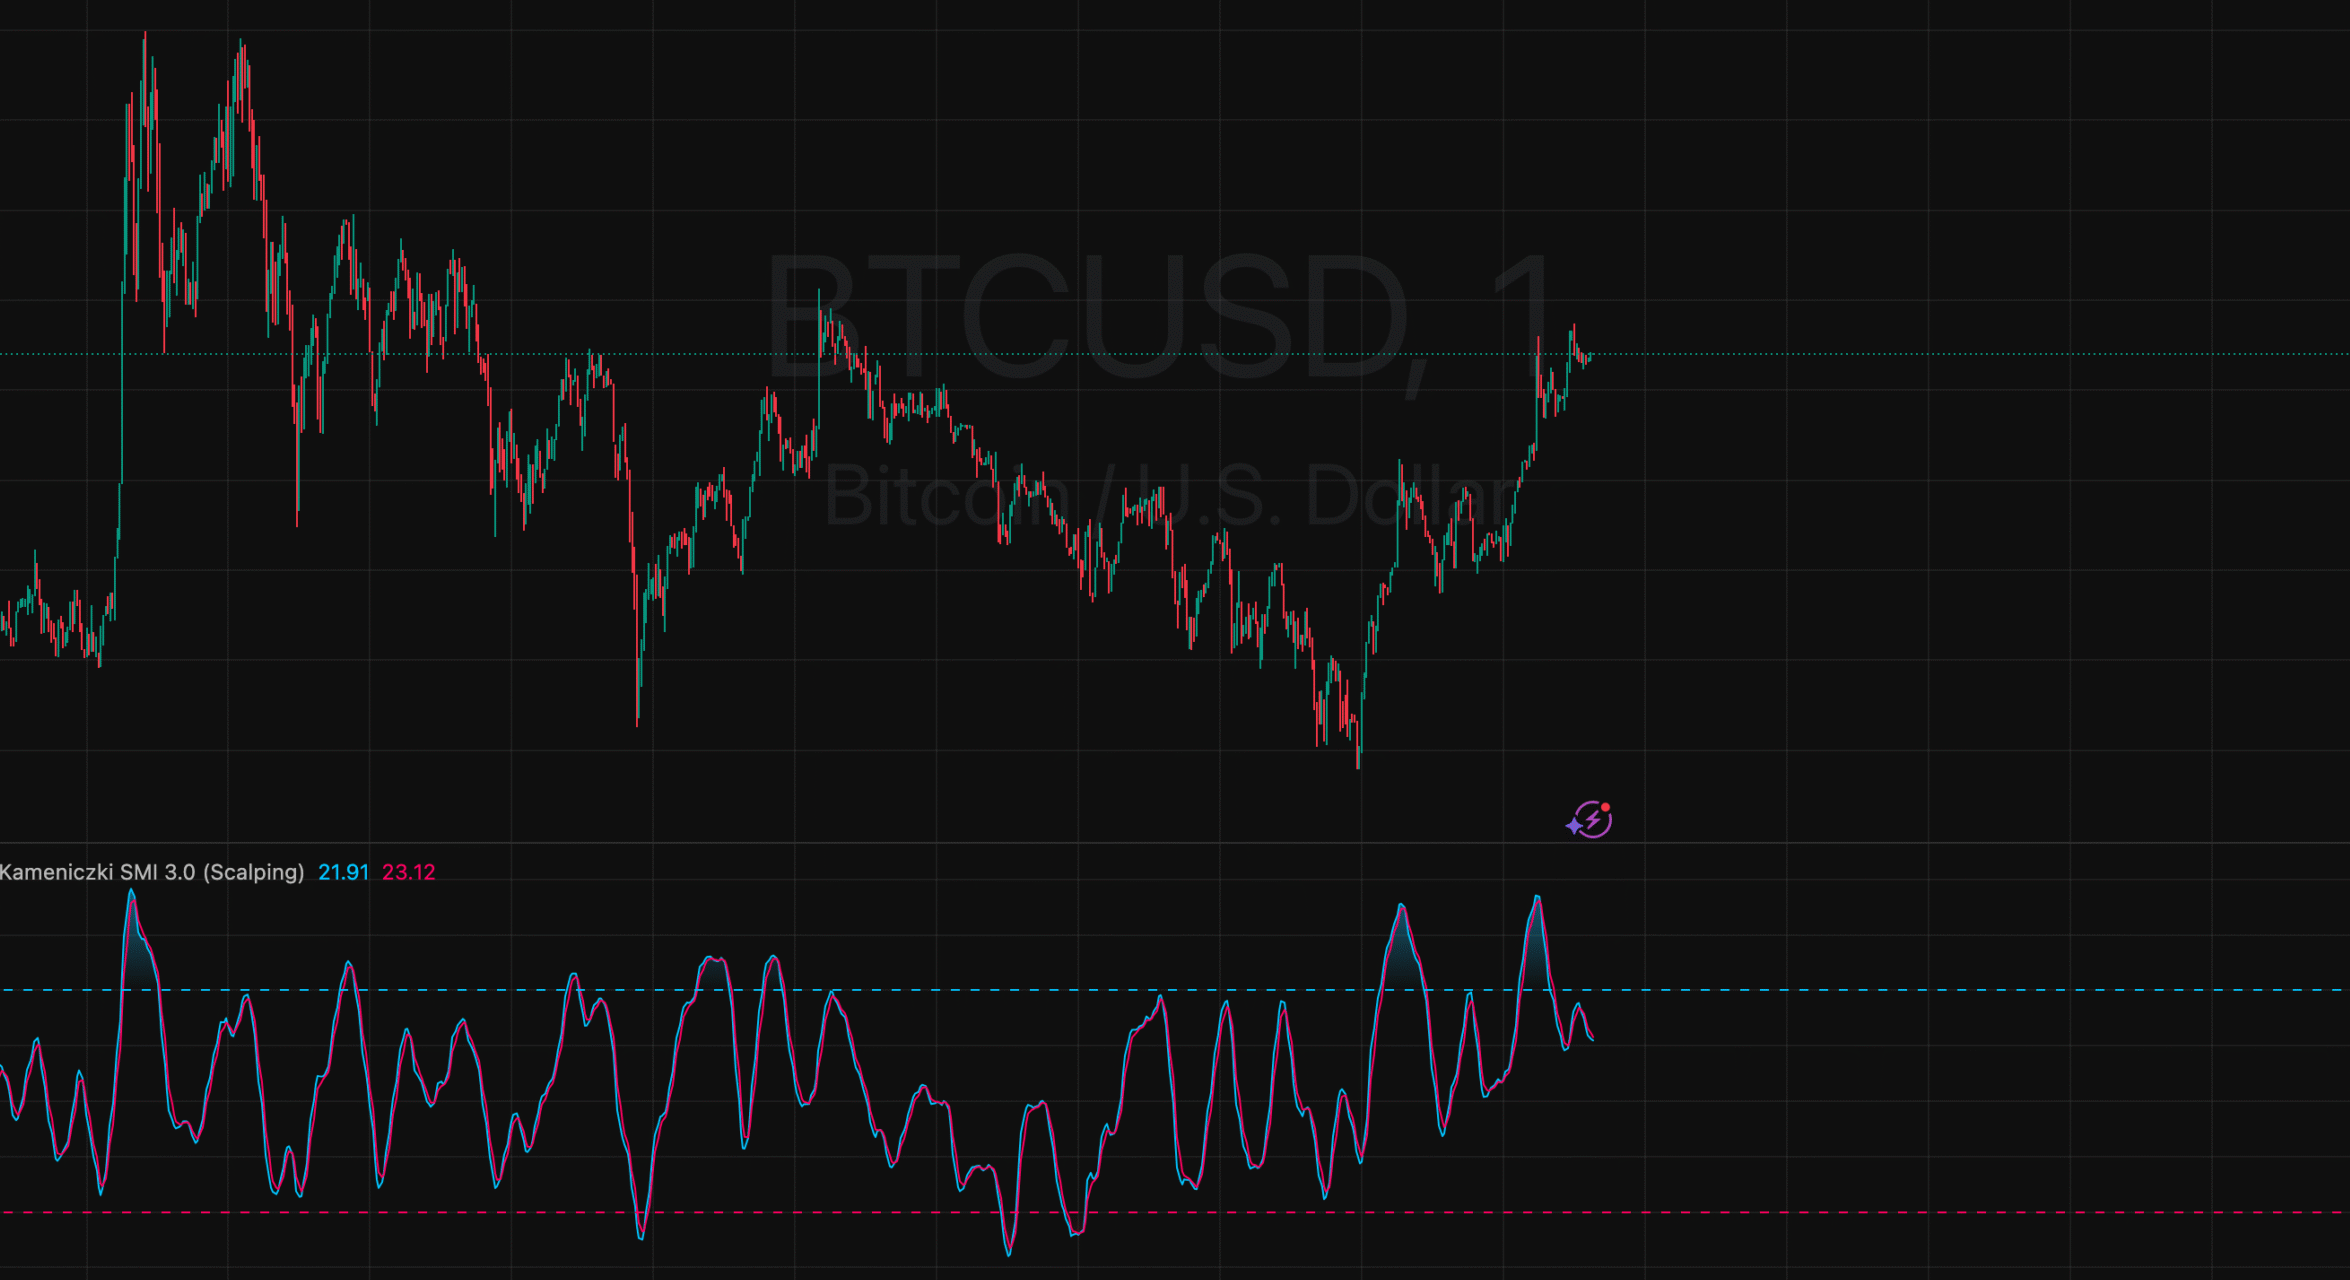
We are proud to announce the release of a new version of our indicator — Kameniczki SMI 3.0. This update introduces the long-awaited Scalping mode, expanding trading possibilities especially for those focused on quick market entries and exits.

The new Scalping mode is designed with an emphasis on high sensitivity and rapid reaction to shifts in market sentiment. In practice, this means that the %K length has been reduced to 5, allowing the indicator to more quickly detect short-term extremes. At the same time, smooth output is maintained thanks to the use of a double exponential moving average (EMA), which helps eliminate unnecessary noise.


Kameniczki SMI 3.0 now offers three trading modes:

  • Scalping – short-term signals on minute-based charts (e.g., 1M, 5M)
  • Day Trading – medium-term settings ideal for daily trading
  • Swing – long-term positions suited for more patient investors


When switching between modes in the settings, the indicator parameters (%K, %D, and EMA) are automatically adjusted, so traders don’t have to configure them manually.

We’ve also preserved the familiar visual elements: gradient fills for overbought and oversold zones, colored SMI bars, and a clear midline. These features make interpreting the indicator intuitive and easy at first glance.

This update is the result of valuable feedback from our community and our ongoing commitment to delivering highly accurate and practically useful tools for modern trading.

We believe the new Scalping mode in Kameniczki SMI 3.0 will help you better time your entries and exits, and improve the accuracy of your trading decisions.

Trading is inherently risky, and many participants may incur losses. The content on this site is not intended as financial advice and should not be interpreted as such. Decisions regarding buying, selling, holding, or trading in securities, commodities, and other markets involve risks that are best addressed with the guidance of qualified financial professionals. Past performance does not guarantee future results.

Hypothetical or simulated performance results have limitations. Unlike actual trading records, simulated results do not represent real trades. Additionally, since these trades have not been executed, the results may not accurately reflect the impact of market factors such as liquidity. Simulated trading programs are typically designed with the benefit of hindsight and based on historical data. There is no assurance that any account will achieve similar profits or losses as shown in simulated results.

Testimonials on this website may not reflect the experiences of other clients and are not a guarantee of future performance or success.

As a provider of technical analysis tools for charting platforms, we do not have access to our customers’ personal trading accounts or brokerage statements. Therefore, we do not assume that our customers perform better or worse than other traders based on any content or tools we provide.

Charts used on this site are powered by TradingView, on which many of our tools are built. TradingView® is a registered trademark of TradingView, Inc. (www.TradingView.com). TradingView® has no affiliation with the owner, developer, or provider of the Services described on this site.

This summary does not represent our full disclaimer. Please refer to our full disclaimer for complete information.